
Operating Expenses: A Quick Reality Check
Before diving deep into a deal, start with a simple question:
Do the operating expenses make sense?
This quick check can save you hours of wasted analysis.
For newer assets (generally built after 2020), operating expenses typically fall in the 30–35% range of Effective Gross Income (EGI).
(EGI = Rent + Other Income – Concessions – Vacancies – Bad Debt)
For older assets (built after 1980, give or take), it’s much harder to beat 45% operating expenses , so underwriters usually pencil in 50% to keep things conservative.
Why Unit Count Matters
Operating expenses aren’t just about age - they’re also influenced by scale.
Mid-size properties (40–80 units) often have higher expense ratios than larger ones because they’re too big for self-management, but too small to justify a full property management team.
Small-size properties (up to 40 units, depending on PM expertise) can generally budget a 30-35% operating expense ratio with an off-site management team.
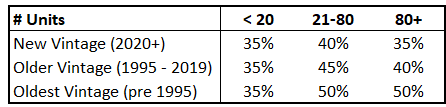
Here’s a quick reference drawn from my analysis of over 5,400 multifamily units across 60+ properties I’ve managed or reviewed, plus insights from underwriting tens of thousands more properties that ultimately didn’t make the cut.
🚩Red Flags🚩 to Watch Out For
If expenses are way outside the norm (e.g., 60% on an ’80s asset), that’s a sign of risk and likely warrants a higher entry cap rate (NOI / Purchase Price = cap rate).
On the flip side, if someone promises 19% operating expenses on a multifamily deal - stop right there. That’s unrealistic! I saw this on a new deal recently and ended the conversation immediately.
Underwriting is as much an art as science, but these benchmarks will help you spot deals that deserve a closer look - and those that don’t.