
The Utility Inflation Trap
In multifamily underwriting, the difference between an institutional-grade sponsor and a generic operator often lies in the treatment of “uncontrollable” expenses. While most underwriters default to a standard 2.5% annual utility escalation, the current regulatory and energy landscape suggests this baseline is no longer defensible.
Using material, localized data isn’t just a due diligence exercise - it is a strategic advantage that prevents massive capital erosion at disposition.
The Arkansas Case Study: A Compounding Deficit
Geographic specificity is the only way to accurately forecast utility risk. National averages mask severe local spikes that can derail a proforma within months.
The Market Reality: In Arkansas, electricity costs have surged by over 30% in the last five years alone.
The Underwriting Disconnect: A standard 2.5% projection assumes a cumulative 13.1% increase over five years. The reality in Arkansas represents a 5.34% CAGR - more than double the common assumption.
The Risk: Under-forecasting this line item creates a quiet, compounding deficit in your Net Operating Income (NOI) that cannot be easily recovered.
The Valuation Multiplier: Why the “Small Numbers” Matter
The most dangerous phrase in asset management is: “Utilities are a small percentage of OPEX; they won’t move the needle.” In a valuation model driven by Cap Rates, “small” misses are magnified into significant losses of equity.
If utility assumptions are off by just 2.5% - 3.0% annually, the impact on terminal value is catastrophic.
Based on the sensitivity analysis below, a 100-unit multifamily property with a standard utility budget could face a $618,609 valuation hit at the point of sale, should annual utility expenses increase by 5.0% per year rather than 2.5% per year.
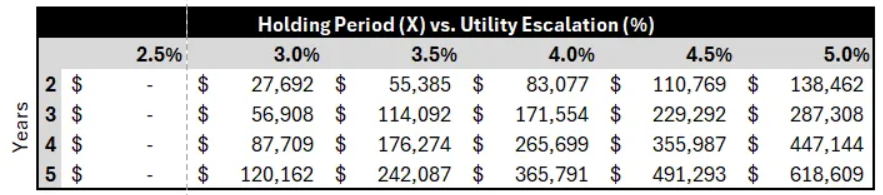
Note: Shortfall relative to a 2.5% baseline, capitalized at 5.0%.
The RUBs Illusion and the “Total Cost” Ceiling
Many sponsors argue that Ratio Utility Billing Systems (RUBs) insulate the owner from these utility rate hikes. This assumes infinite resident elasticity, which rarely exists in the real world.
Total Cost to Inhabit (TCI): Residents view rent and utilities as one monthly expense. If utilities grow at 5.3% while market rents grow at 3.0%, Gross Charged Rent will eventually hit a ceiling, and base-line rent growth slows or declines.
Rent Compression: To maintain occupancy, opwners/operators are eventually forced to trade rent growth for utility recovery.
Exit Friction: Savvy buyers audit RUBs recovery rates. If “Other Income” is propped up by unsustainable utility bill-backs, buyers will adjust their offer price accordingly.
The Bottom Line
Precise underwriting is about defending the exit strategy. By studying state-level trends and PSC rate filings, we ensure that our $619k in projected gains doesn’t evaporate into a utility provider’s rate hike.